2026/05/14 GBP/JPY Trade Strategy

Today's GBP/JPY call: Sell.
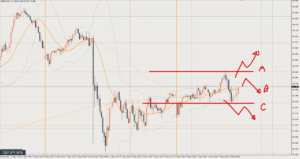
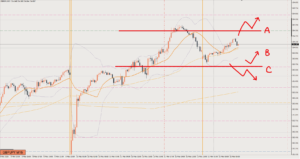
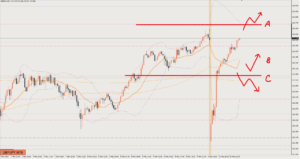
Timeframes below the daily chart point to selling, but the monthly chart and weekly chart are rising.
The daily chart has been stalling for quite a while now, so we also need to watch for a reversal to the upside from around here.
The 4-hour chart (H4) is also starting to take a shape that looks like it’s turning up (making higher lows).
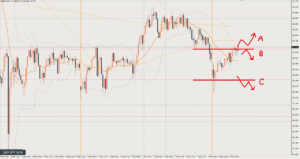
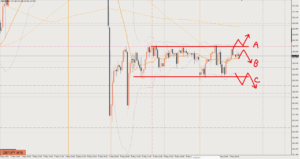
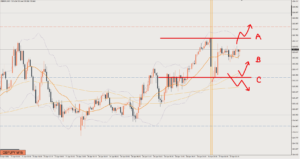
For now I’m still only thinking about selling, and it’s a sell as long as price doesn’t break above Line A.
I’d like to sell if it starts turning down (making lower highs) from here.
Review

It was Scenario B.
The rise stalled at Line A, and after one big drop, I went short at circle ①, the retracement.
After that, the market context made it fine to hold. My view was that it would reach at least the 1-hour range low.
In reality, it dropped in one go and even went past the target.
I moved my stop-loss level to around 212.8, set the limit at the blue line, and went to bed. 140 pips
It’s been a while since the market moved in such an easy-to-trade way.
If you couldn’t get in at circle ①, circle ② is also good, I think. That one is about hitting the drop from the 5-minute chart (M5) rally high.
After that, you’d sell at circle ③ under Scenario C.
This article reflects the author's personal view of the market. It does not recommend any specific trade; all investment decisions are your own responsibility.