2026/06/18 GBP/JPY Trade Strategy

Today's GBP/JPY call: Wait and see.
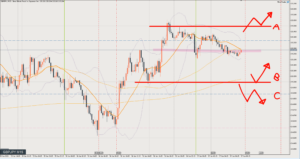
The FOMC really broke up the chart, so I’ll need to wait a bit before I can build a strategy.
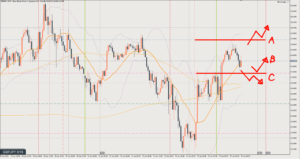
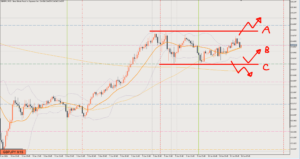
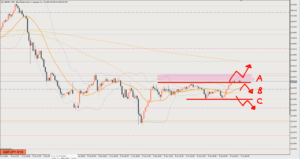
Looking only at the lower timeframes, it’s a situation where you could buy within the green box, but the bigger flow is down, so this rise is about probing where selling the rally will come in.
Still, if it rises all the way to the top of the green box, that’s nearly 50 pips, so going for it as a short-term trade is fine.
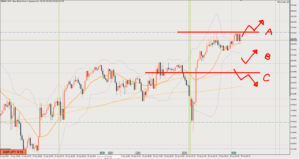
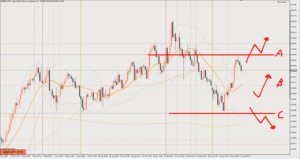
One factor in favor of buying is that price is near the bottom of the daily chart range.
However, if you buy with that bias, wait until signs of a reversal, such as a double bottom, appear on the 4-hour chart or the 1-hour chart (H1).
Basically, my idea is to sell once this short-term upward flow stalls and turns down, so there may be nothing to do today?
Review

It went down.
It didn’t rise as far as the top of the green box.
It dropped after forming what looked like a double top at the pink line, and you could go short on the 5-minute chart (M5) level retracement around the red circle.
The target was the yellow line, but price broke straight through it and went all the way to the next pink line below, so you could have taken about 90 pips.
The entry was easy, too.
I hadn’t written this up as a scenario, so it’s not counted.
This article reflects the author's personal view of the market. It does not recommend any specific trade; all investment decisions are your own responsibility.