2026/02/18 GBP/JPY Trade Strategy

Today's GBP/JPY call: Sell.
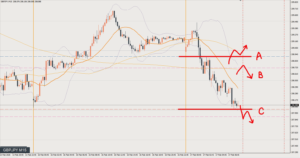
Price is sitting just below daily chart support after breaking it, so technically the current bias is to sell.
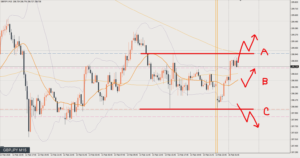
However, the 1-hour chart (H1) is starting to form higher lows, which makes it a hard spot to sell.
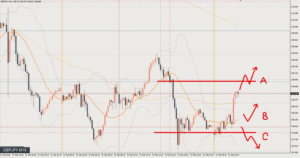
Other factors in favor of selling: the previous day’s bearish candle on the daily chart, the downtrend on the 4-hour chart, and the bearish tone in GBP/USD.
On the other hand, the factor in favor of buying is that USD/JPY looks set to rise.
It could go either way, so it looks like a tricky one.
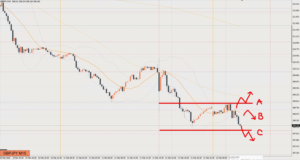
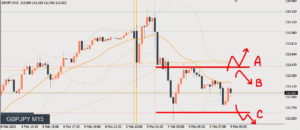
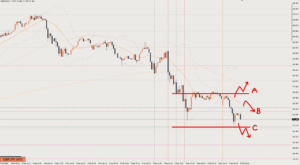
The plan is to sell if price fails to break above A and starts turning down (making lower highs), and to buy if it breaks above A.
Review

It was Scenario A.
Price moved just as described in the scenario, but if you entered at circle ①, you’d probably want to exit once around the blue circle.
The overall flow was bearish, so it’s about being wary of a false breakout.
In that case, re-enter at circle ②.
After that, take profit where it reaches 208.8 and starts to drop. 64pips
In reality it extends even higher, but near the highs is a spot where you need to watch out for sell-the-rally retracement selling, so I think it’s better to take profit rather than hold.
This article reflects the author's personal view of the market. It does not recommend any specific trade; all investment decisions are your own responsibility.