2026/02/09 USD/JPY Trade Strategy

Today's USD/JPY call: Sell.
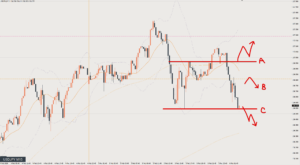
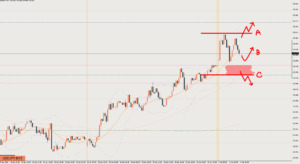
On the 4-hour chart (H4), price is still just barely within the pullback price zone, but it is starting to break the low.
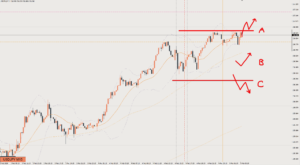
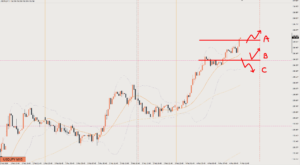
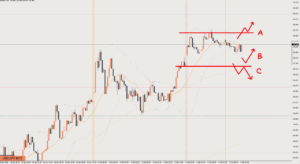
All the other timeframes have a bearish bias.
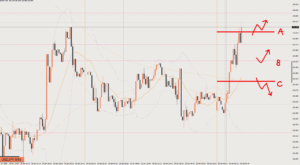
The 15-minute chart (M15) is in a range for now, so I’ll either wait for price to come back near the range high, or look to sell the rally after a break below.
If it breaks below, the market situation changes, so depending on how far it breaks, it might be better to treat the blue line near the letter B as the retracement target.
Review

It played out as Scenario B.
The entry was a short on the turn down (lower highs) after price came back up to around Line A.
Price dropped smoothly to the target, but even after touching the target line it didn’t reverse, not even on the 5-minute chart (M5), so I held.
I took profit when a double bottom formed at the pink line two levels below. 102 pips
This article reflects the author's personal view of the market. It does not recommend any specific trade; all investment decisions are your own responsibility.